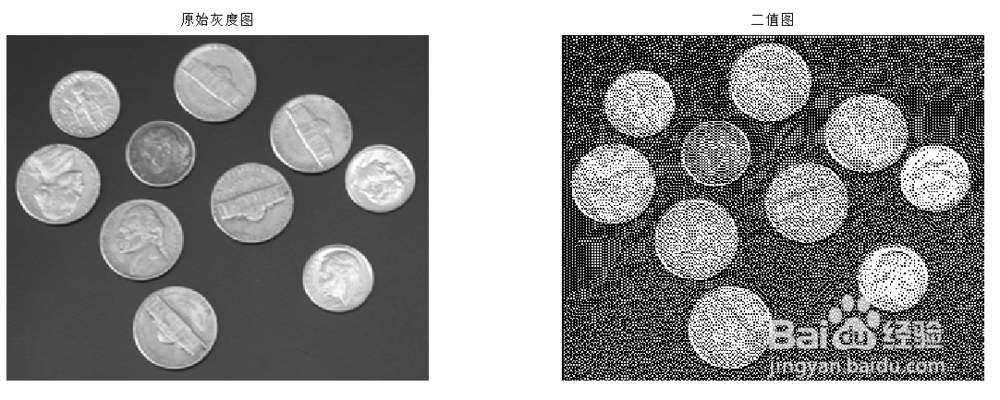
1、dither函数,用于实现图像的抖动,其调用格式如下:
X=dither(RGB,map);将真彩图的颜色图索引图
X=dither(I);将灰度图转换成二值图
示例:利用dither将灰度图抖动成二值图
编写对应的m文件如下:
clear all;
I=imread('coins.png');
bw=dither(I);
subplot(1,2,1)
imshow(I);
title('原始灰度图')
subplot(1,2,2)
imshow(bw);
title('二值图');
程序运行结果如下图:
2、im2bw函数设定阀值,将RGB(真彩图调袭),I(灰度图),X(索引图)转化为二值图,对应函数的调用格式如下:
BW=im2bw(X,map,level);
BW=im2bw(I,level);
BW=im2bw(RGB,level);
示例:将真彩图转换为二值图
编写对应的m文件如下:
RGB=imread(‘peppers.png’);
BW=im2bw(RGB,0.6);
subplot(1,2,1)
imshow(RGB);
title('原始真彩图');
subplot(1,2,2)
imshow(BW);
title('利用阈值转换为二值图');
程序运行结果如下图:

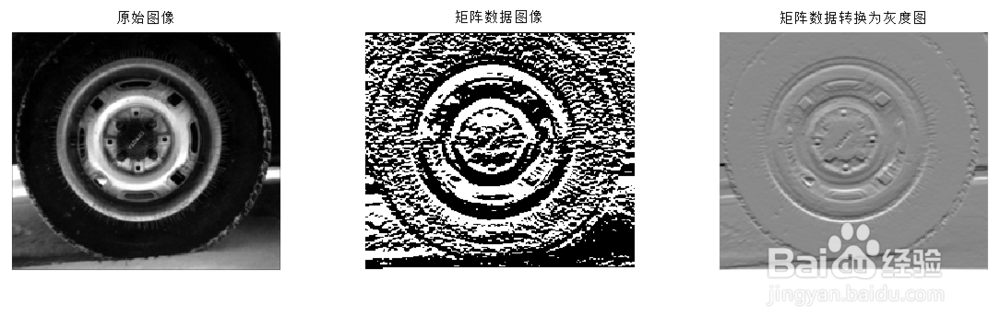
3、mat2gray函数将数据矩阵转换为灰度图像,其对应的调用格式如下:
I=mat2gray(A,[max,min]):按照指定的区间将数据矩阵A转换为灰度曲线:
示例:利用mat2gray函数将矩阵数据转换为灰度图
编写对应的m文件如下:
I=imread(‘tire.gif’);
A=filter2(fspecial('sobel'),I);
B=mat2gray(A);
subplot(1,3,1)
imshow(I);
title('原始图像');
subplot(1,3,2)
imshow(A);
title('矩阵数据图像')
subplot(1,3,3)
imshow(B);
title('矩阵数据转换为灰度图');
程序运行结果如下图:
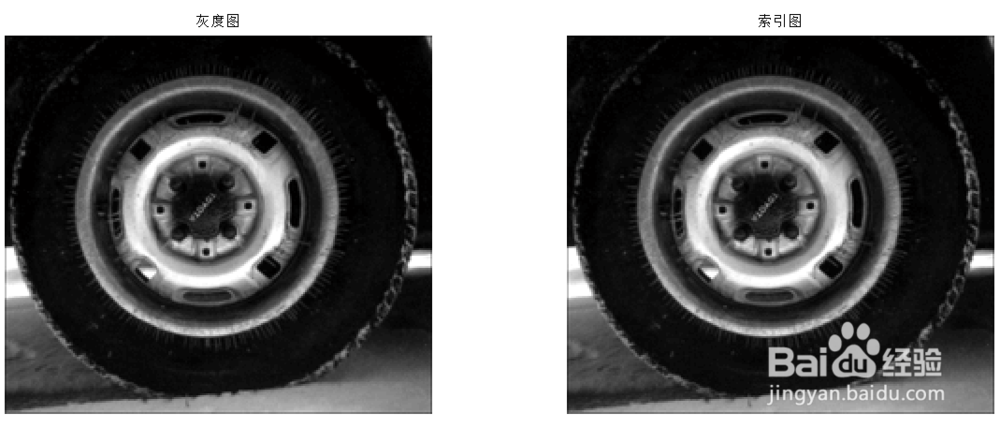
4、gray2ind函数将灰度图转换为索引图,其对应的调用格式如下:
[X,map]=gray2ind(I,n);n表示灰度级,默认为64;
示例:利用gray2ind函数将灰度图转换为索引图
编写对应的m文件如下:
clear all;
I=imread('tire.tif');
[X,map]=gray2ind(I,64);
subplot(1,2,1)
imshow(I);
title('灰度图');
subplot(1,2,2)
imshow(X,map);
title('索引图');
程序运行结果如下图:
5、ind2gray函数,ind2rgb函数分别表示将索引图转换为灰度图,真彩图,其调用格式如下:
I=ind2gray(X,map);
RGB=ind2rgb(X,map);
示例:利用ind2gray函数,ind2rgb函数将索引图分别转换为灰度图和真彩图 编写对应的m文件如下:
clear all;
load trees;
I=ind2gray(X,map);
RGB=ind2rgb(X,map);
subplot(1,3,1)
imshow(X,map);
title('原始索引图')
subplot(1,3,2)
imshow(I);
title('灰度图');
subplot(1,3,3)
imshow(RGB);
title('真彩图');
程序运行结果如下图:

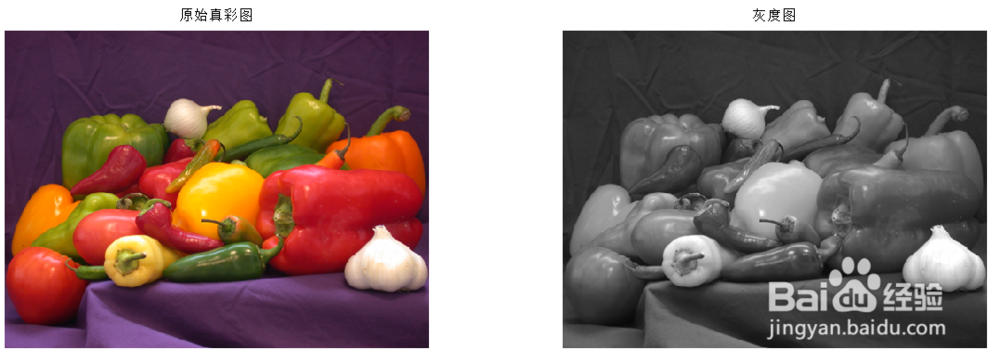
6、rgb2gray函数,rgb2ind函数分别表示将真彩图转换为灰度图和索引图,其对牢牺应调用格式如下:
I=rgb2gray(RGB);
[X,map]=rgb2ind(RGB,N);N表示map中的颜色项数
示例:将一幅真彩图转换为索引图
编写对应的m文件如下:
蹲各羞 clear all;
RGB=imread('peppers.png');
I=rgb2gray(RGB);
subplot(1,2,1)
imshow(RGB);
title('原始真彩图');
subplot(1,2,2)
imshow(I);
title('灰度图');
程序运行结果如下图: